Participant Demographics
As of January 23, 2025
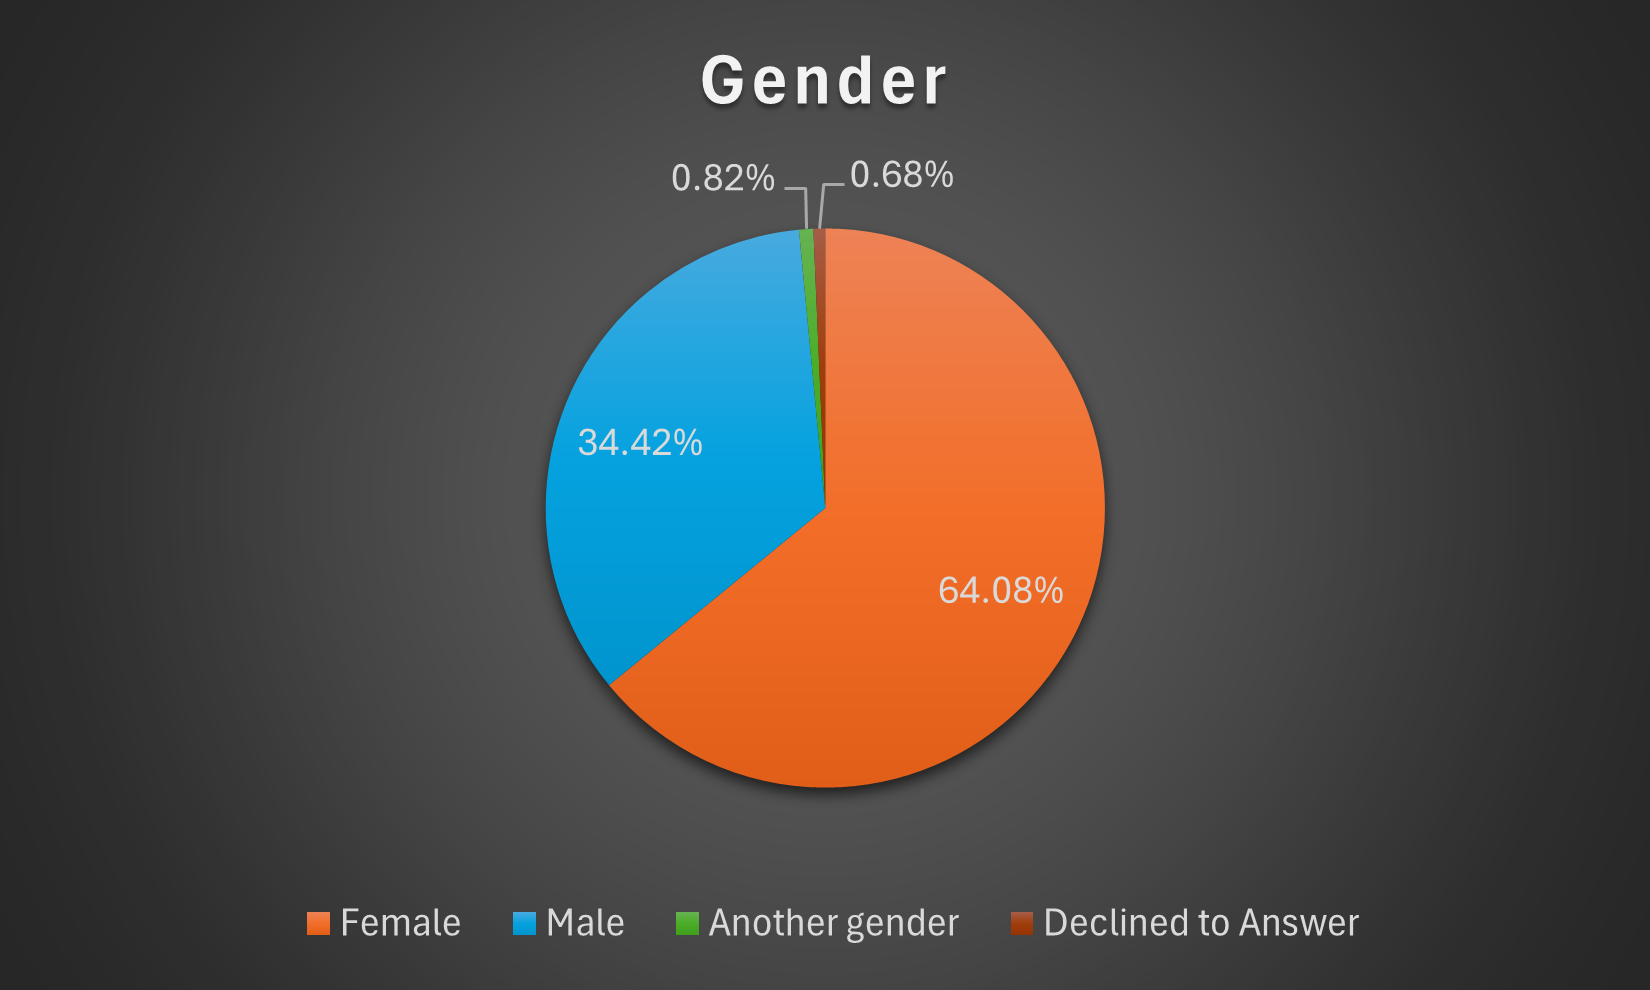
Gender
| Male |
6,157 |
| Female |
11,463 |
| Another gender |
147 |
| Decline to answer |
122 |
|
 |
Status
| Undergraduate (non-transfer) |
11,895 |
| Undergraduate (transferred in) |
3,031 |
| Summer school student |
382 |
| Other student |
1,268 |
| Cal Staff |
253 |
| Non-university |
742 |
| Decline to answer |
318 |
|
 |
*The data only represents participants' response at intake.
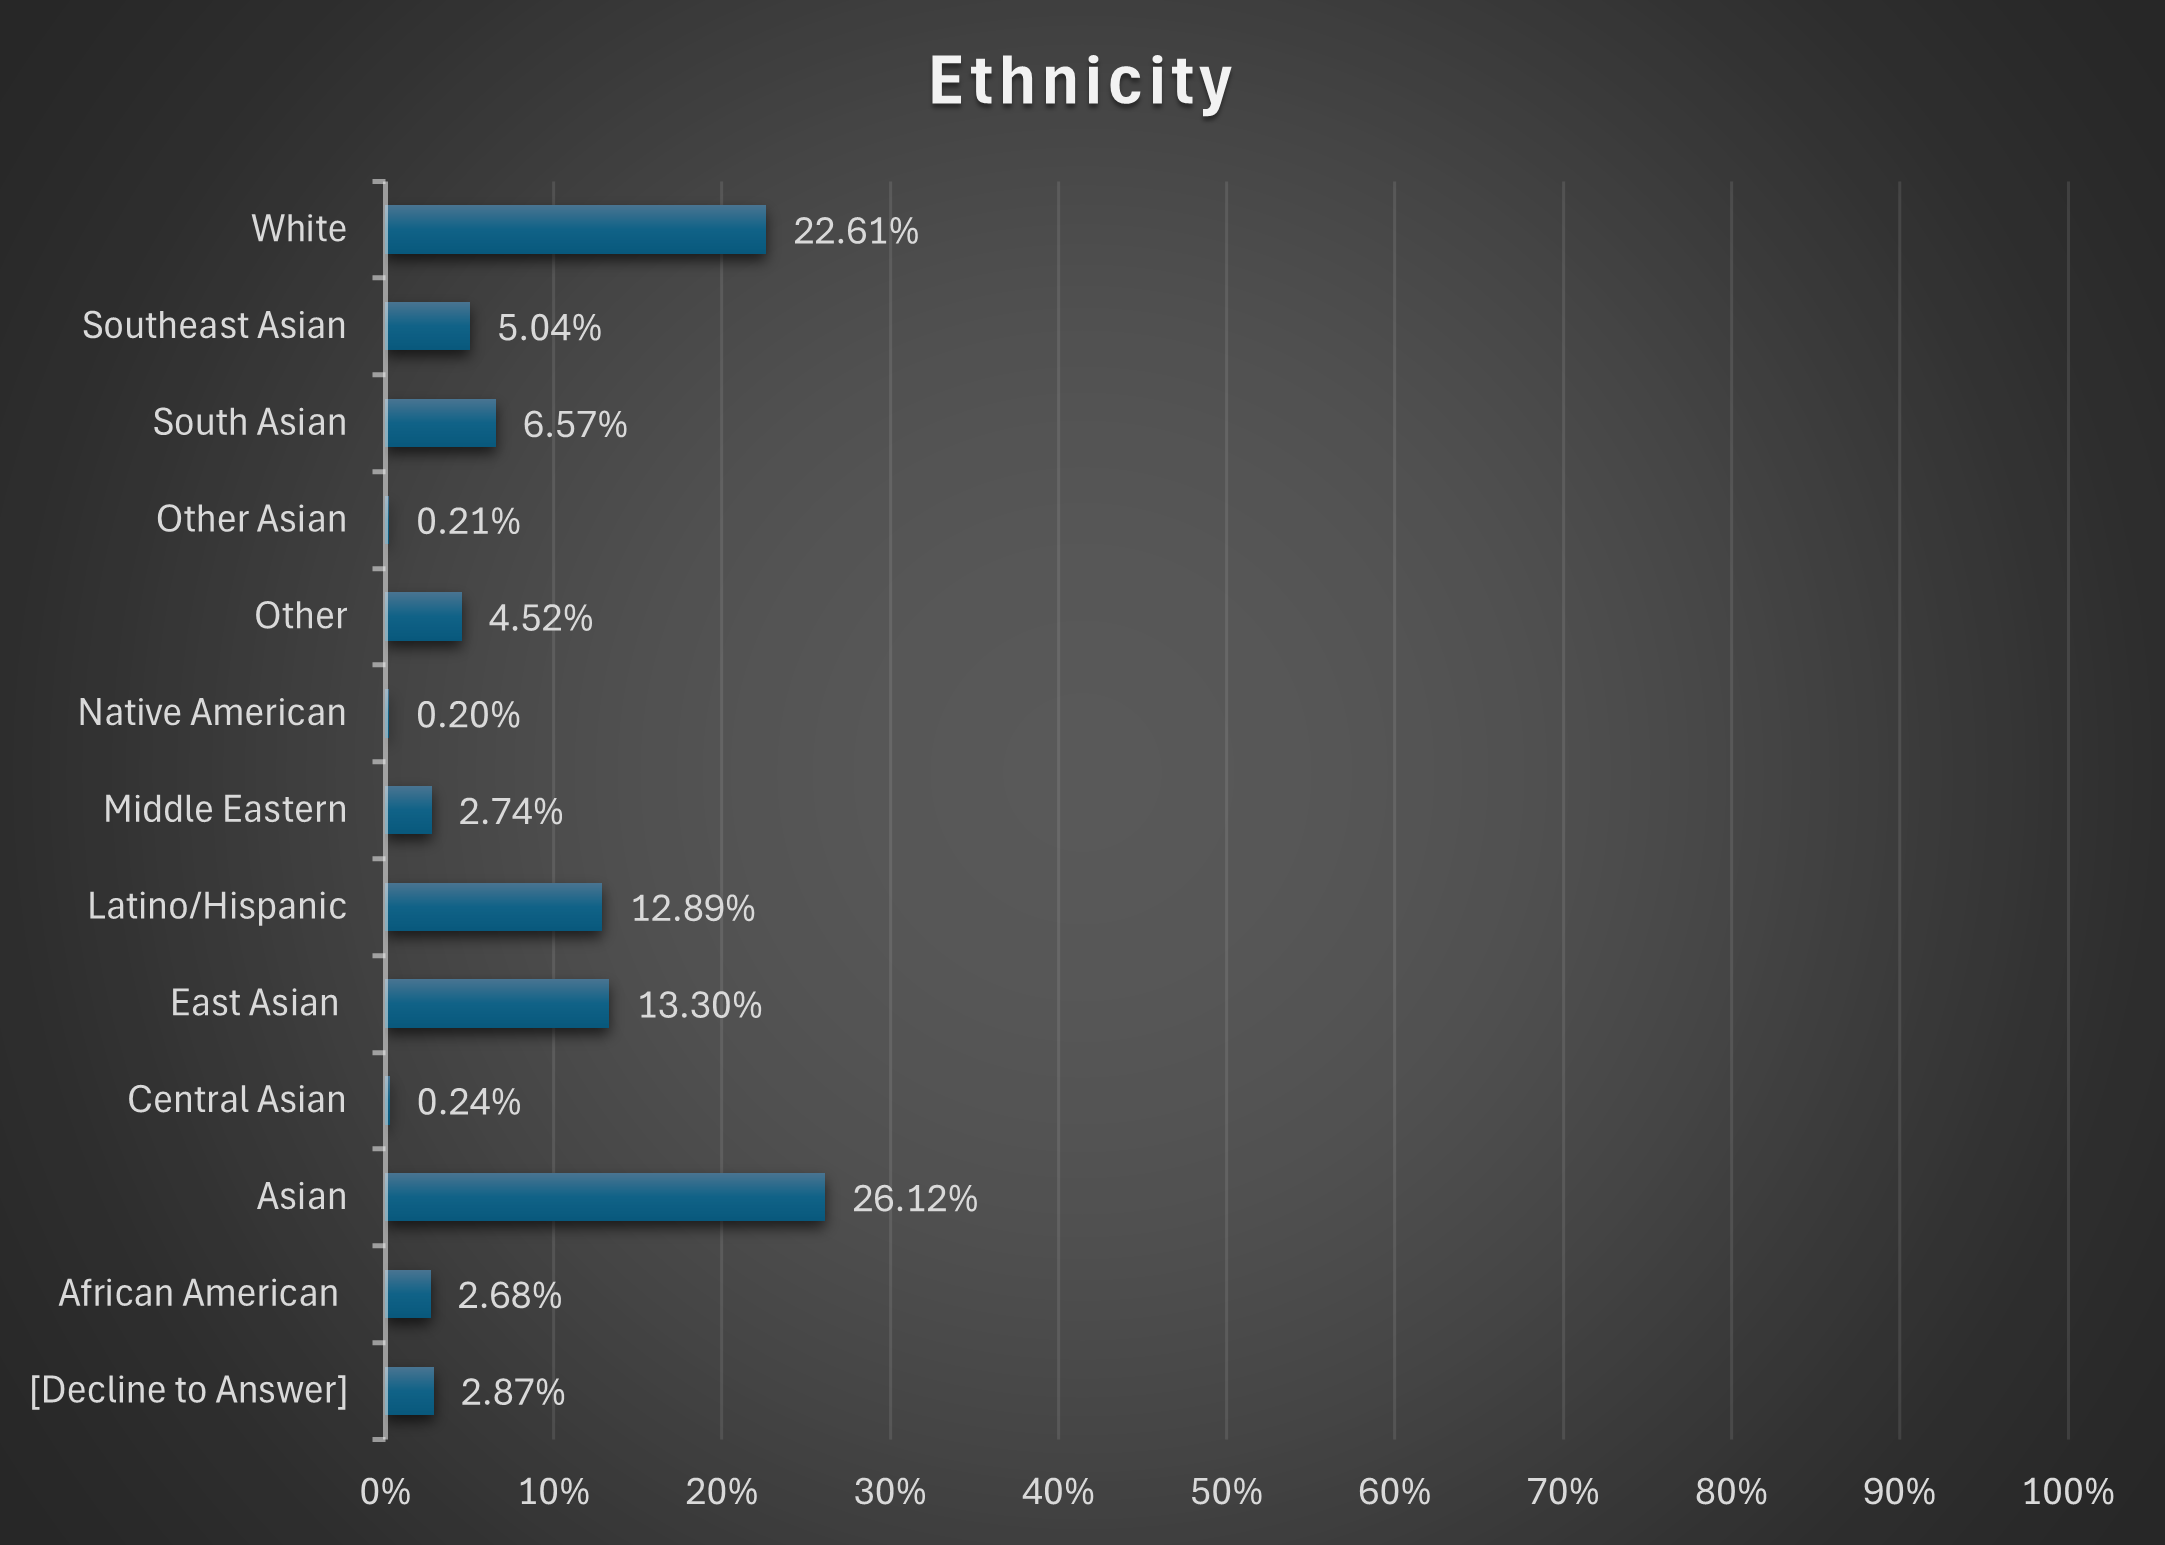
Ethnicity
| African American |
479 |
| Asian |
4,673 |
| Latino/ Hispanic |
2,306 |
| Middle Eastern |
491 |
| Native American |
36 |
| White |
4,045 |
| Other |
809 |
| Decline to answer |
513 |
| Central Asian |
43 |
| Southeast Asian |
901 |
| East Asian |
2,380 |
| South Asian |
1,176 |
| Other Asian |
37 |
|
|  |
Highest Level of Education
| Some High School |
515 |
| High School/ GED |
6.259 |
| Some College |
6.068 |
| 2-year College Degree |
2,064 |
| 4-year College Degree |
2,137 |
| Master's Degree |
522 |
| Doctoral Degree |
66 |
| Professional Degree (MD, JD) |
65 |
| Decline to Answer |
193 |
|
 |
*The data only represents participants' response at intake.
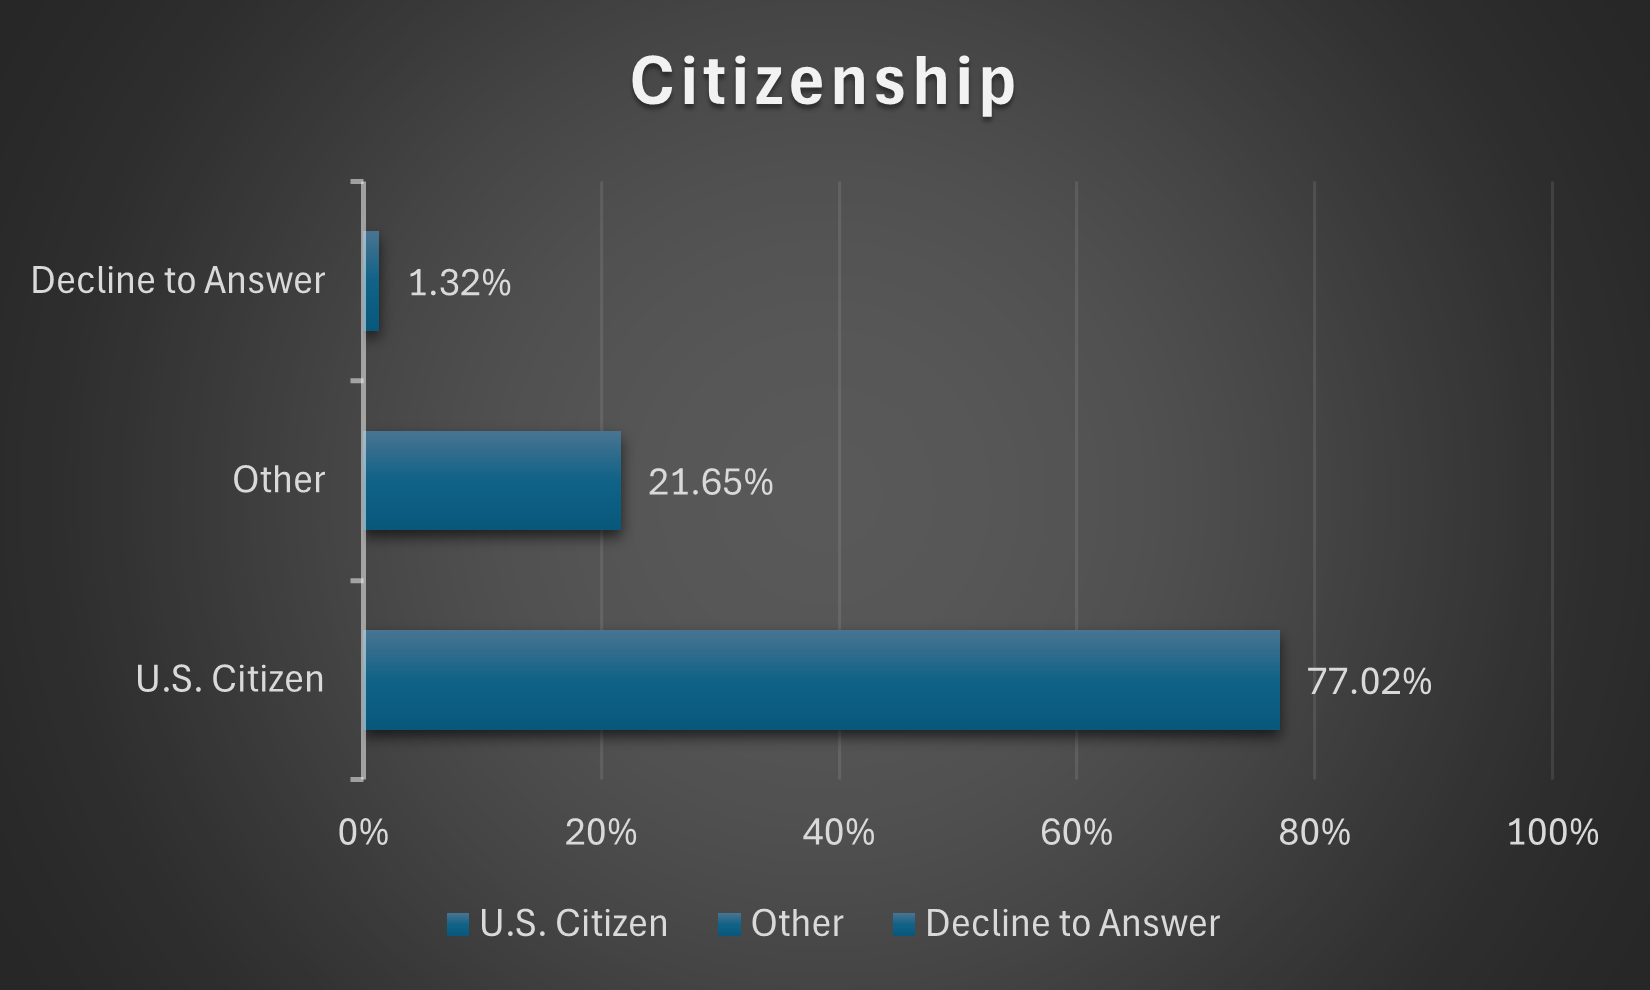
Citizenship
| U.S. Citizen |
13,779 |
| Other |
3,873 |
| Decline to Answer |
237 |
|
 |
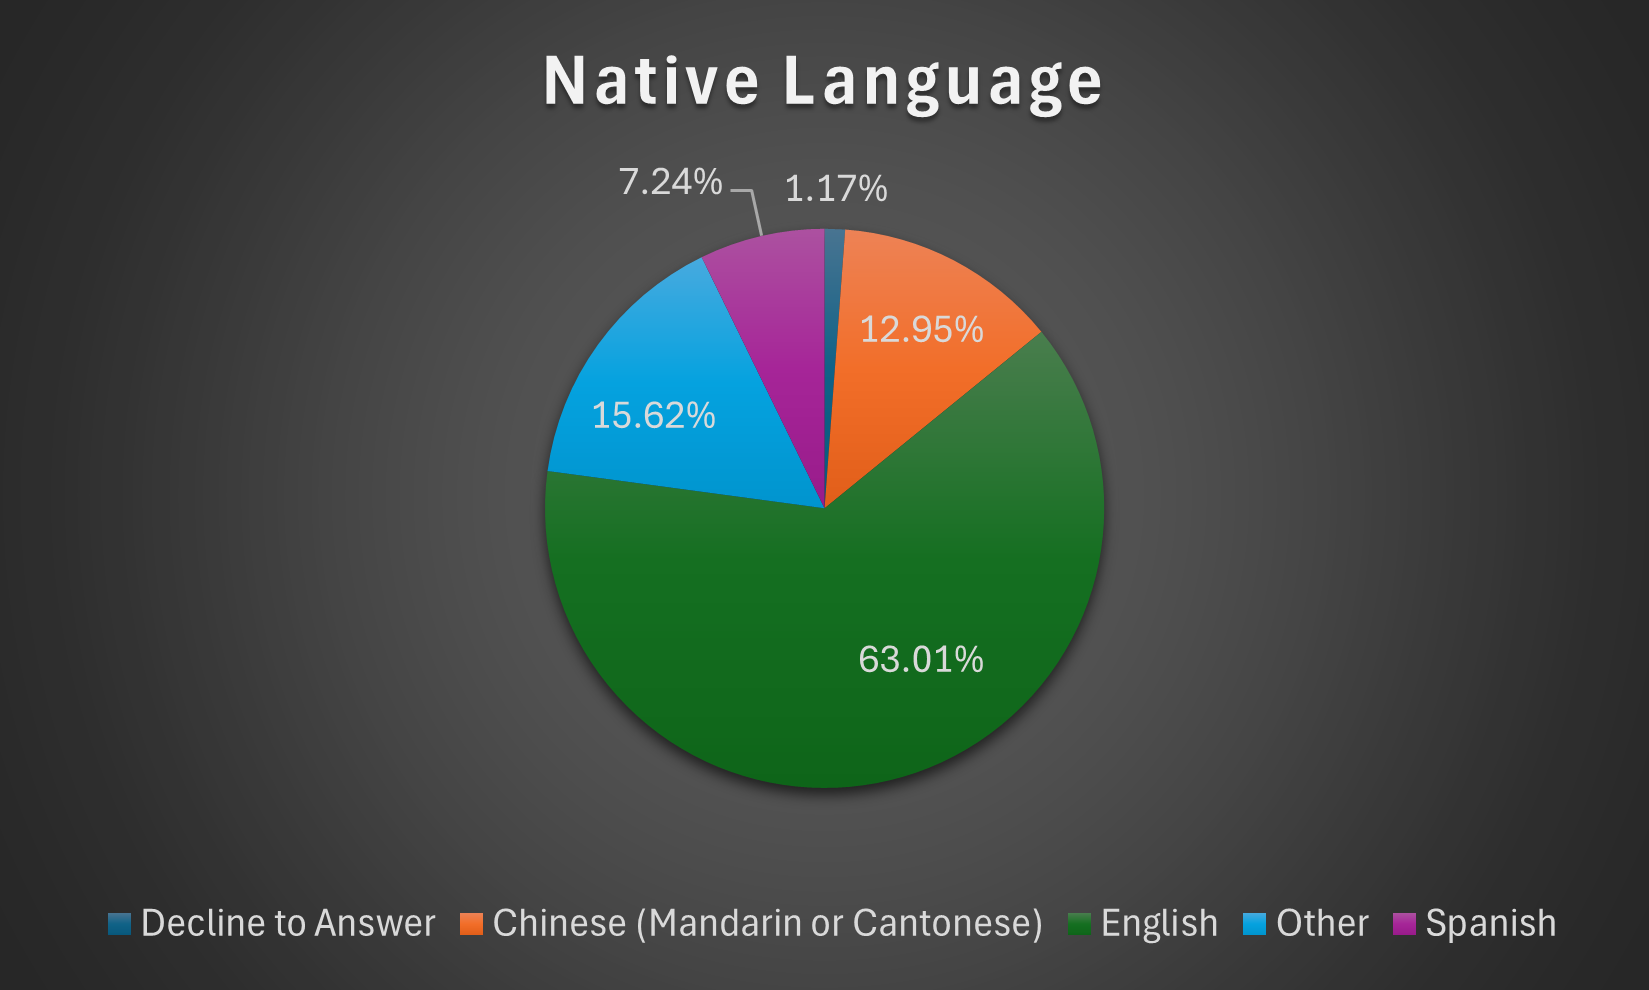
Native Language
| English |
11,271 |
| Spanish |
1,296 |
| Chinese (Mandarin or Cantonese) |
2,317 |
| Other |
2,795 |
| Decline to Answer |
210 |
|
 |
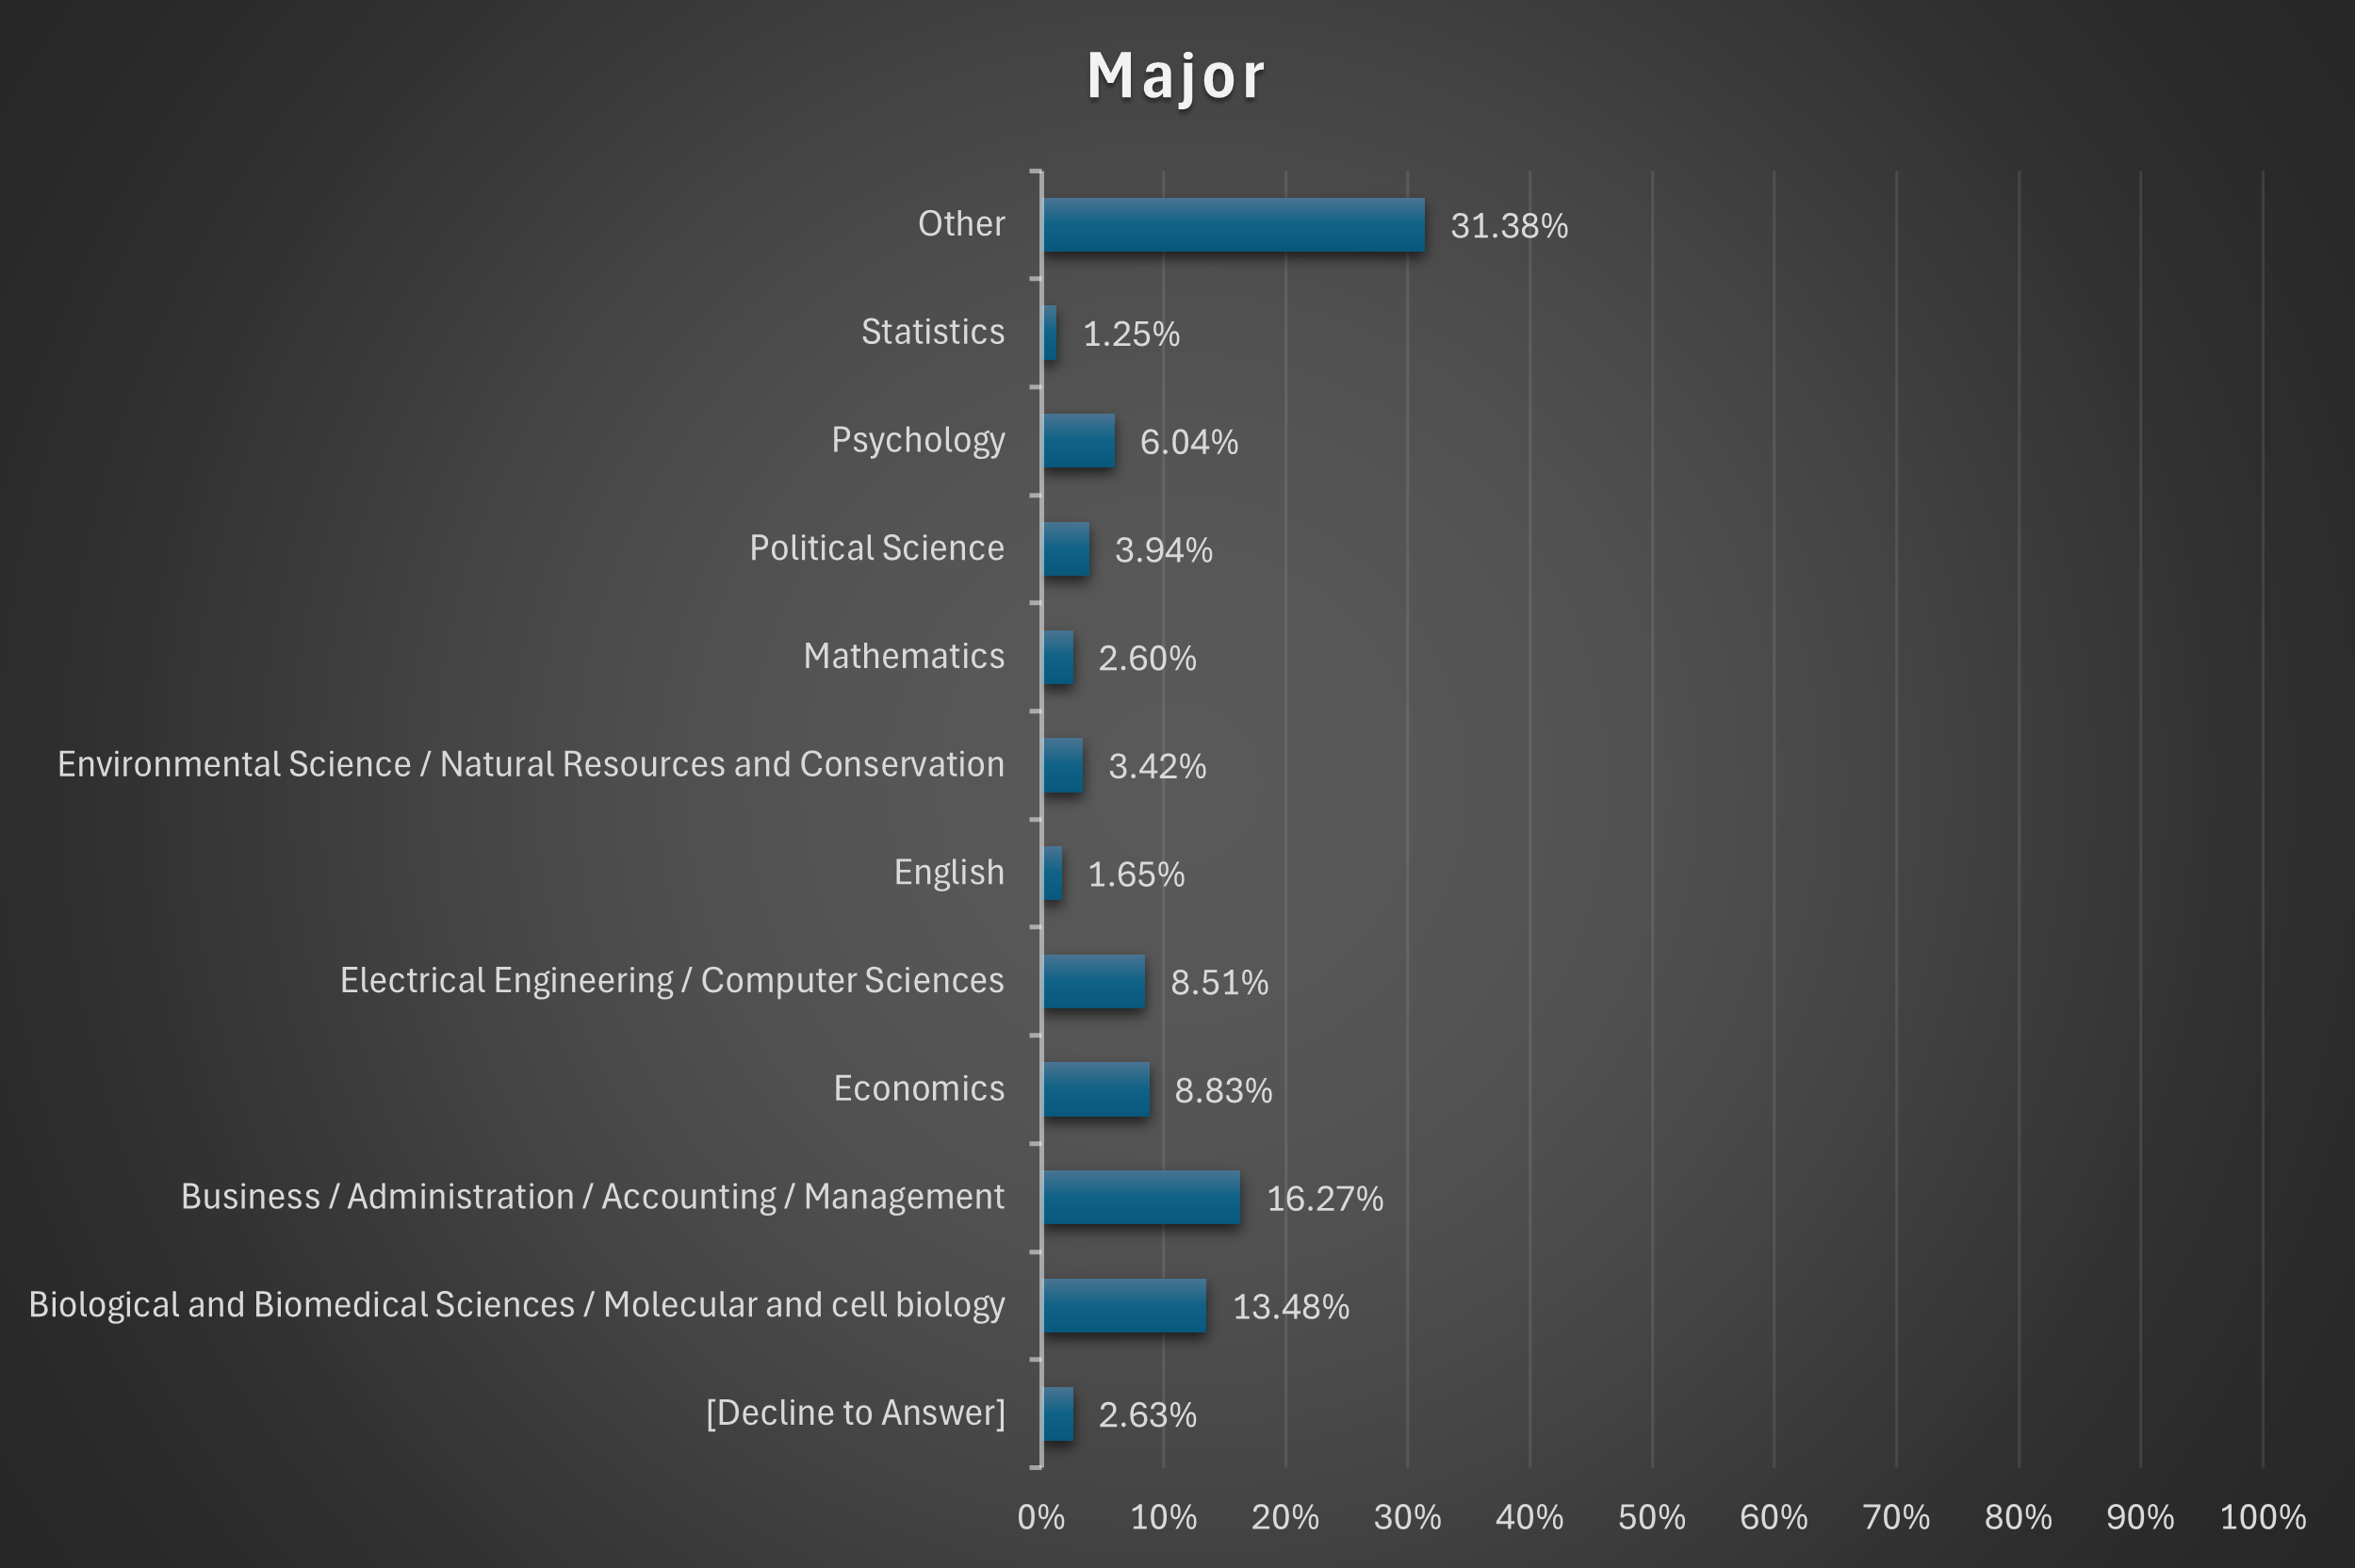
Major
| Electrical Engineering/ Computer Sciences |
1,522 |
| Political Science |
705 |
| Economics |
1,579 |
| Psychology |
1,080 |
| Buisness/ Administration/ Accounting/ Management |
2,910 |
| Environmental Science/ Natural Resources and Conservation |
612 |
| English |
296 |
| Biological and Biomedical Sciences/ Molecular and Cell Biology |
2,411 |
| Mathematics |
466 |
| Statistics |
224 |
| Other |
5,614 |
| Decline to Answer |
470 |
|
 |
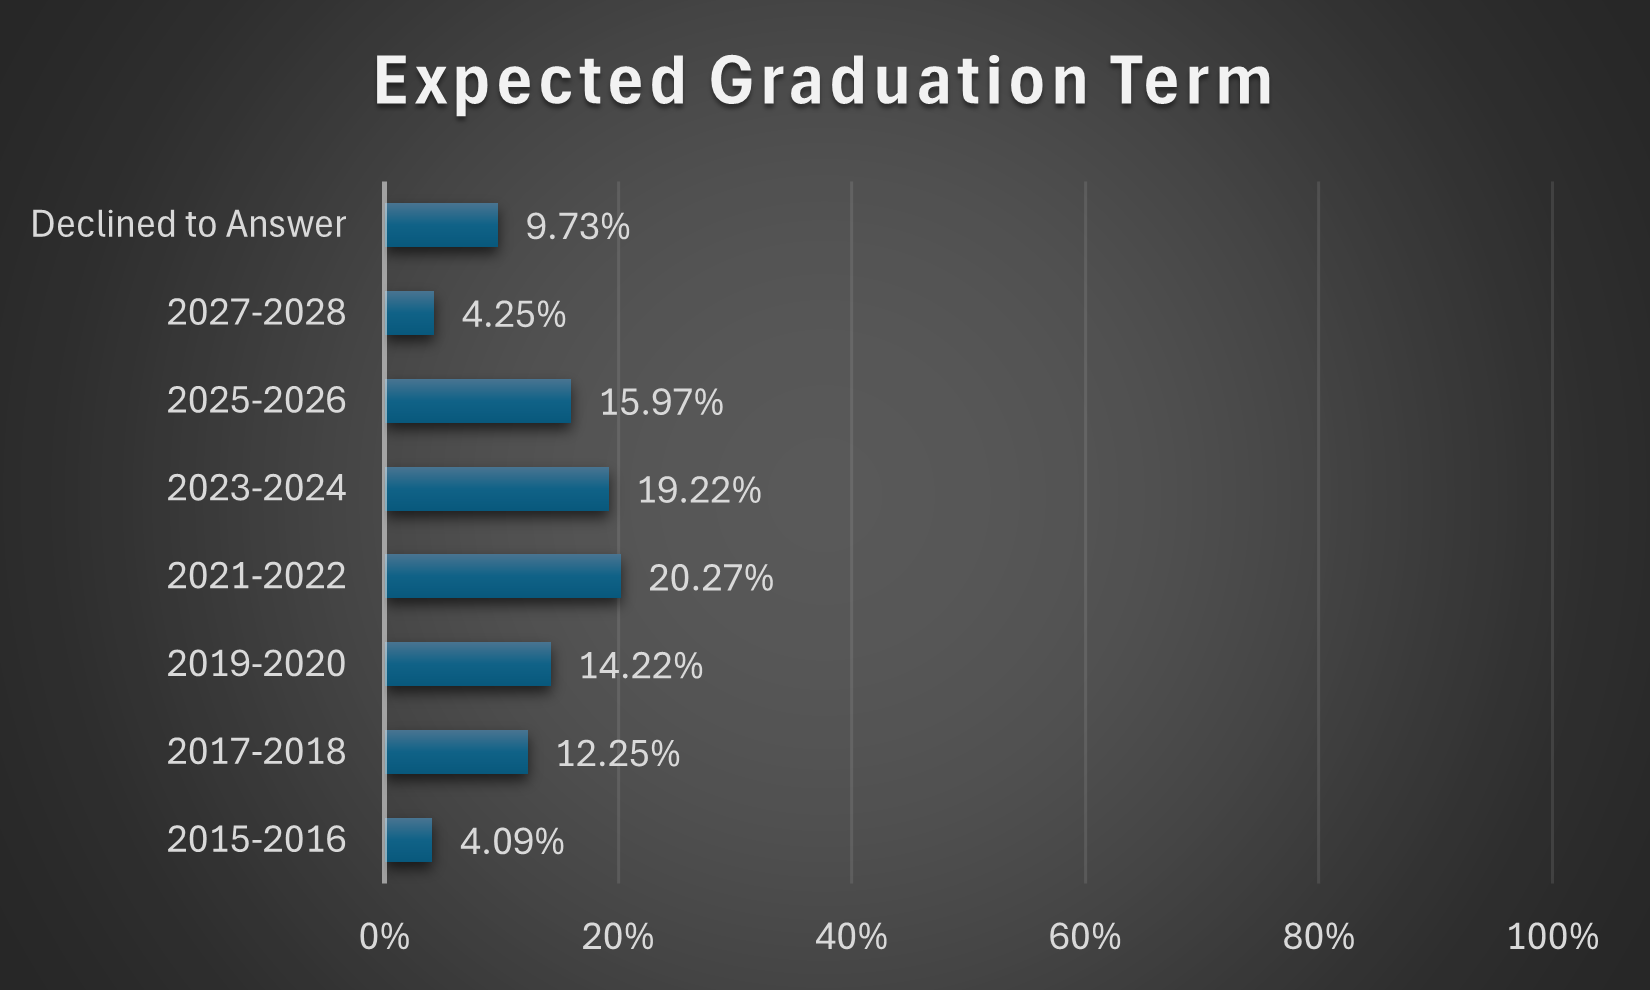
Graduation Term
| 2015 |
126 |
| 2016 |
606 |
| 2017 |
1,022 |
2018 |
1,170 |
2019
|
1,151 |
| 2020 |
1,393 |
| 2021 |
1,638 |
| 2022 |
1,988 |
| 2023 |
1,443 |
| 2024 |
1,995 |
| 2025 |
1,704 |
| 2026 |
1,153 |
| 2027 |
549 |
| 2028 |
211 |
| Decline to Answer |
1,740 |
|
 |
Birth Year
| 1965-1970 (Including before 1965) |
101 |
| 1971-1975 |
54 |
| 1976-1980 |
67 |
| 1981-1985 |
183 |
| 1986-1990 |
640 |
| 1991-1995 |
2,875 |
| 1996-2000 (Including after 1999) |
7,096 |
| 2001-2006 |
6,625 |
| Decline to Answer |
248 |
|
 |
*Please note that for education, status and major, the data only represents participants' response at intake
